Reserving
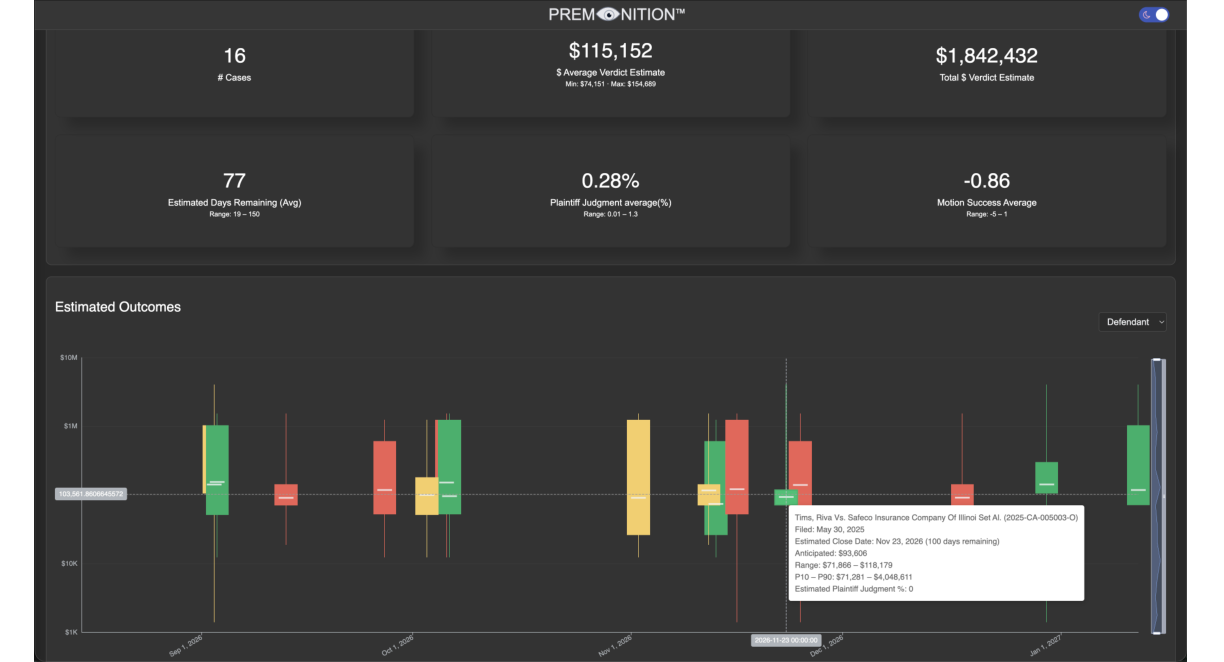
Reserving is a more certain process. While estimating the likely cost, close date and outcome of individual cases is highly uncertain, a portfolio of litigation as a whole will tend towards averages and historical trends. The issue is outliers — Nuclear Verdicts and Rogue Juries, which cases might we be concerned with?
- 2.47% of Plaintiff Lawyers are responsible for 90% of insurer losses.
- Judges with prior Nuclear Verdicts are more liable to produce future ones.
- Judges with previous Appeal Overturns are the most likely to be overturned.
- Cases where one side gains a 5+ motion advantage usually see that side prevail (often quickly).
- Venue is important, Courts like Gwinnett, GA and Seminole, FL are responsible for most Plaintiff Judgments.
Supplementing traditional reserving with Real Time Litigation Analytics can only make it more accurate and help identify the 10% of cases that result in 90% of losses.
Signal Estimates
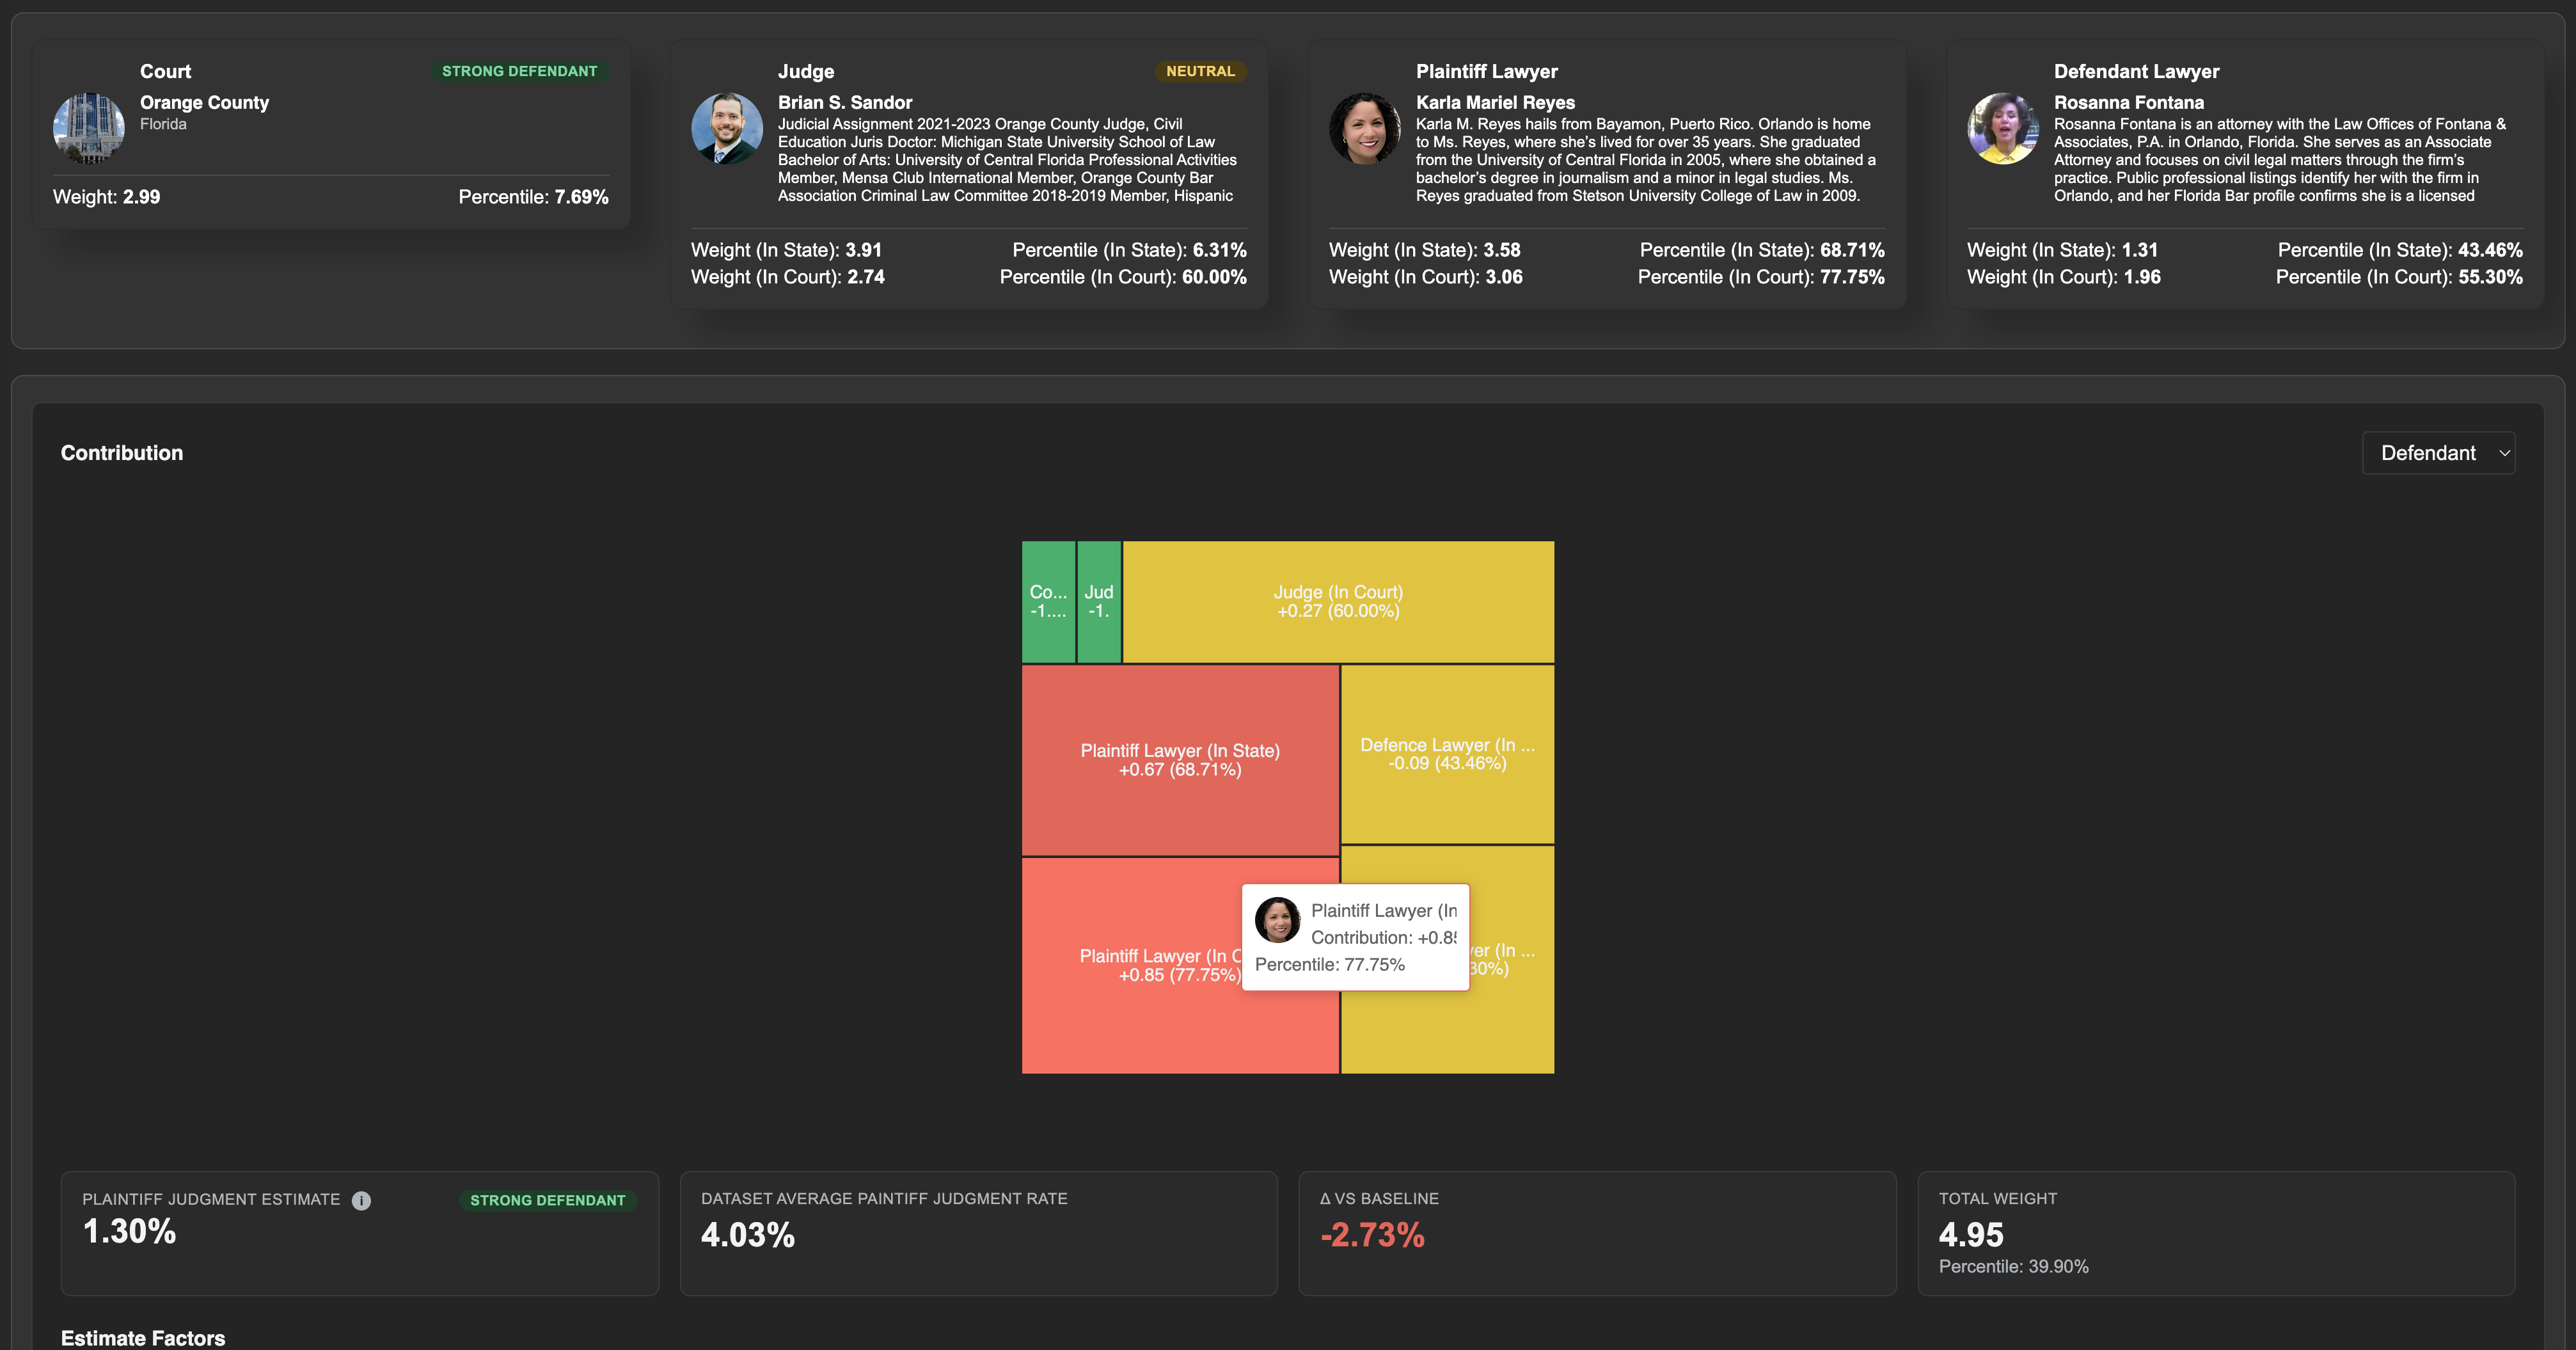
Traditional case analysis focusses on facts and law. However, the legal system is deeply flawed and often driven by human inputs. The wrong combinations of these can be catastrophic, especially for small insurers.
In this example, a Strong Defense Court and Neutral Judge is offset by a strong Plaintiff Lawyer (68th percentile Statewide and 77th for the Court).
Case Duration
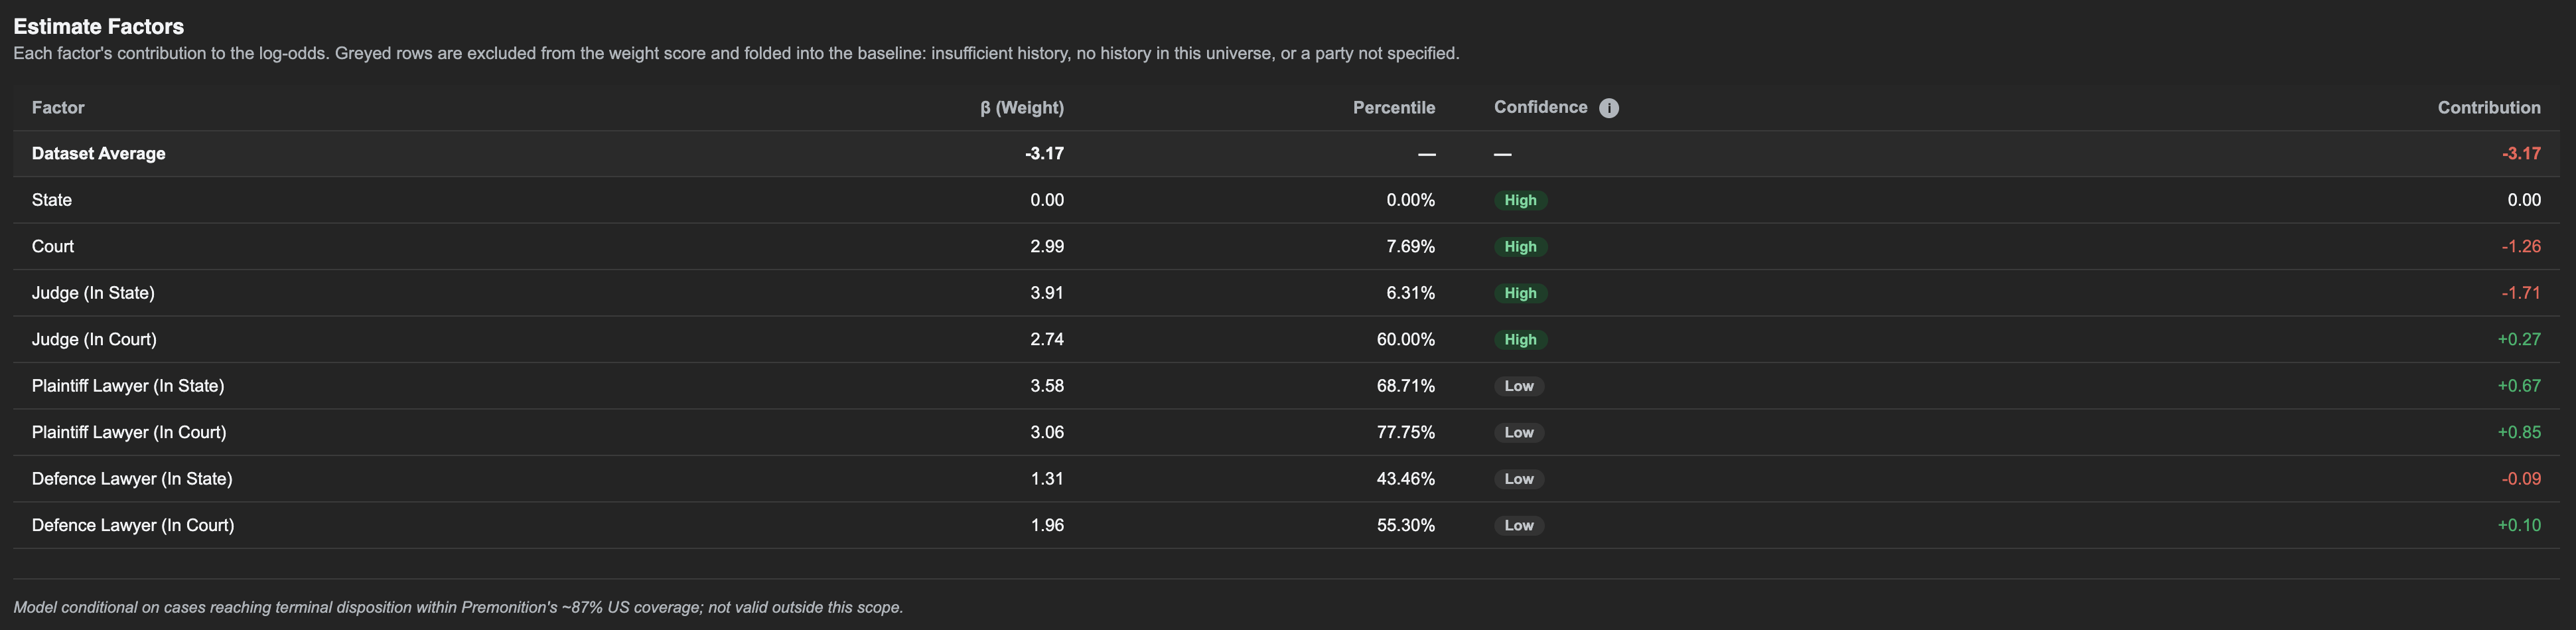
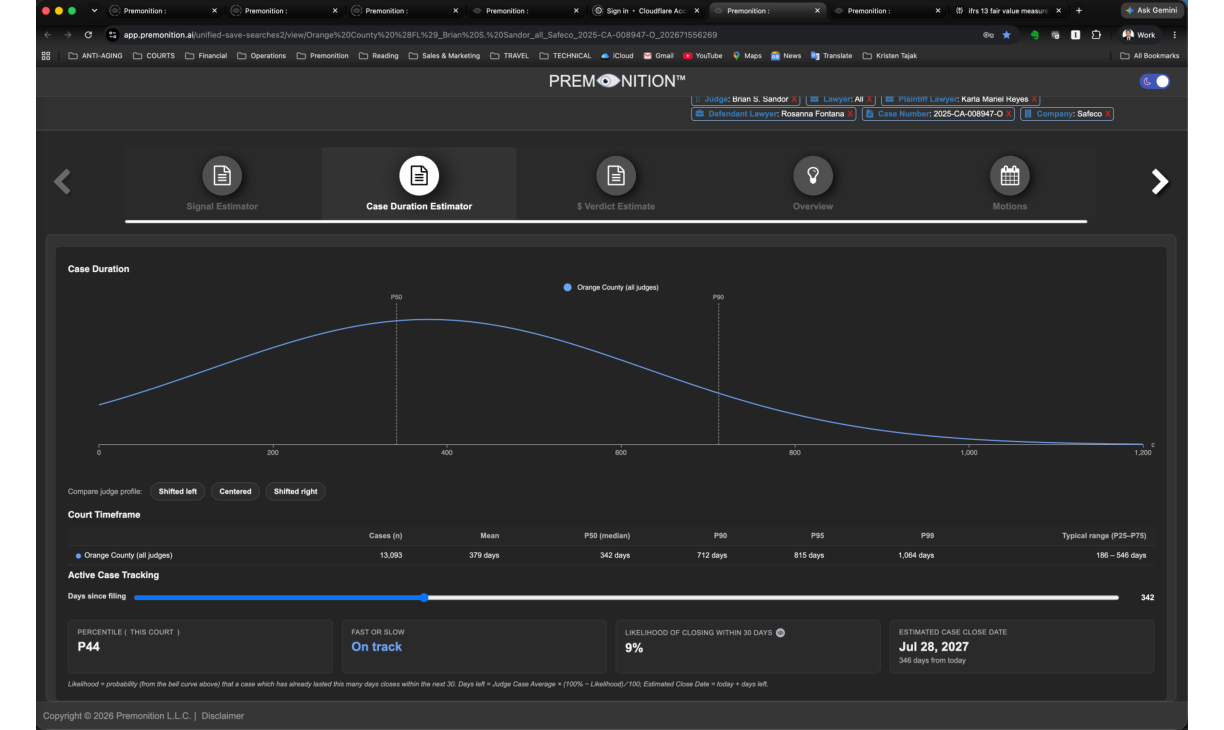
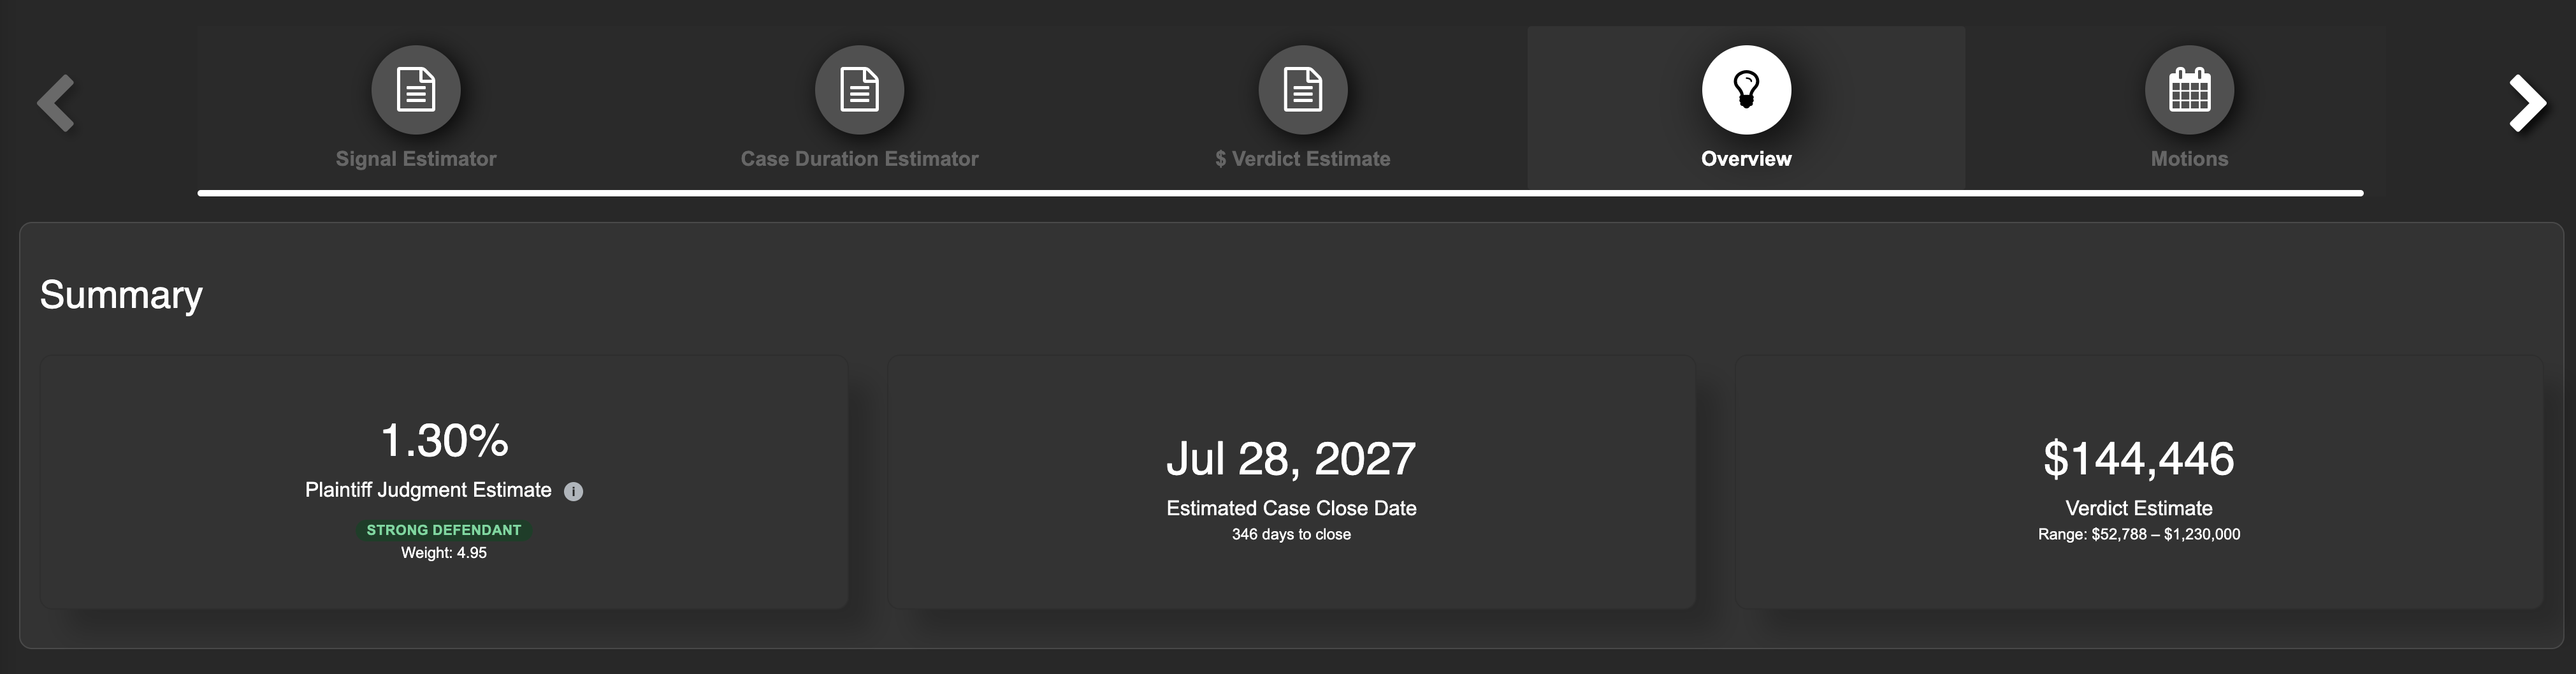
Starting with knowledge of case durations for the court filtered by case type, the case is analyzed to be in the 44th percentile by case duration with an estimated remaining duration of 346 days and a 9% chance of closing in the next 30 days. This information is useful later in predicting likely payouts and payment due timing.
Percentile (This Court): P44
Fast or Slow: On track
Likelihood of Closing Within 30 Days: 9%
Estimated Case Close Date: Jul 28, 2027 (346 days)
Motions
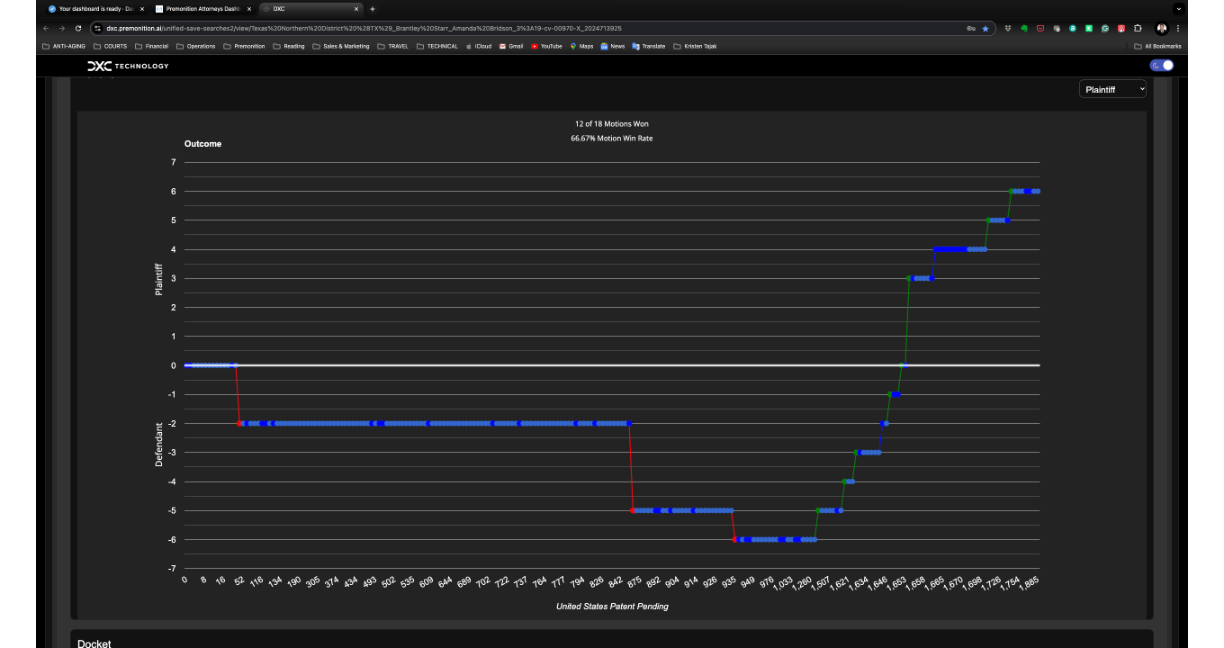
Litigation on television and in the public mind is decided by a wise Judge having an epiphany, swinging his gavel to leave all participants living happily ever after. In reality, litigation is long, slow, boring and uncertain (for most participants…). Cases are not won in a single swoop of brilliant trial skill, but rather by the slow and steady accumulation of motions wins, or losses, leaving one side unable to put on a good case and forcing a settlement. Premonition can provide hourly updates on cases, parsing motions into wins and losses then plotting them into graphs while providing alerts for outliers.
Finding out how a case was going traditionally meant calling Local Counsel for each matter, to eventually be told “everything’s great” or “it could go either way”. Here we can see we have won 12 of 18 motions with a 66.67% Motion Win Rate. This obviates the need for a check-in call.
“If you cannot express it in numbers, your knowledge is of a meagre and unsatisfactory kind.” — Lord Kelvin
Overview
The overview tells us:
- The likelihood of the case having an adverse outcome.
- When we can expect it to close.
- How much it is likely to cost.
Over 200 Academic Studies have shown that algorithms beat human decision making nearly all the time. Premonition believes AI is here to augment human decision making, to provide — “A very, very unfair advantage in litigation”.
Risk Portfolio Analysis
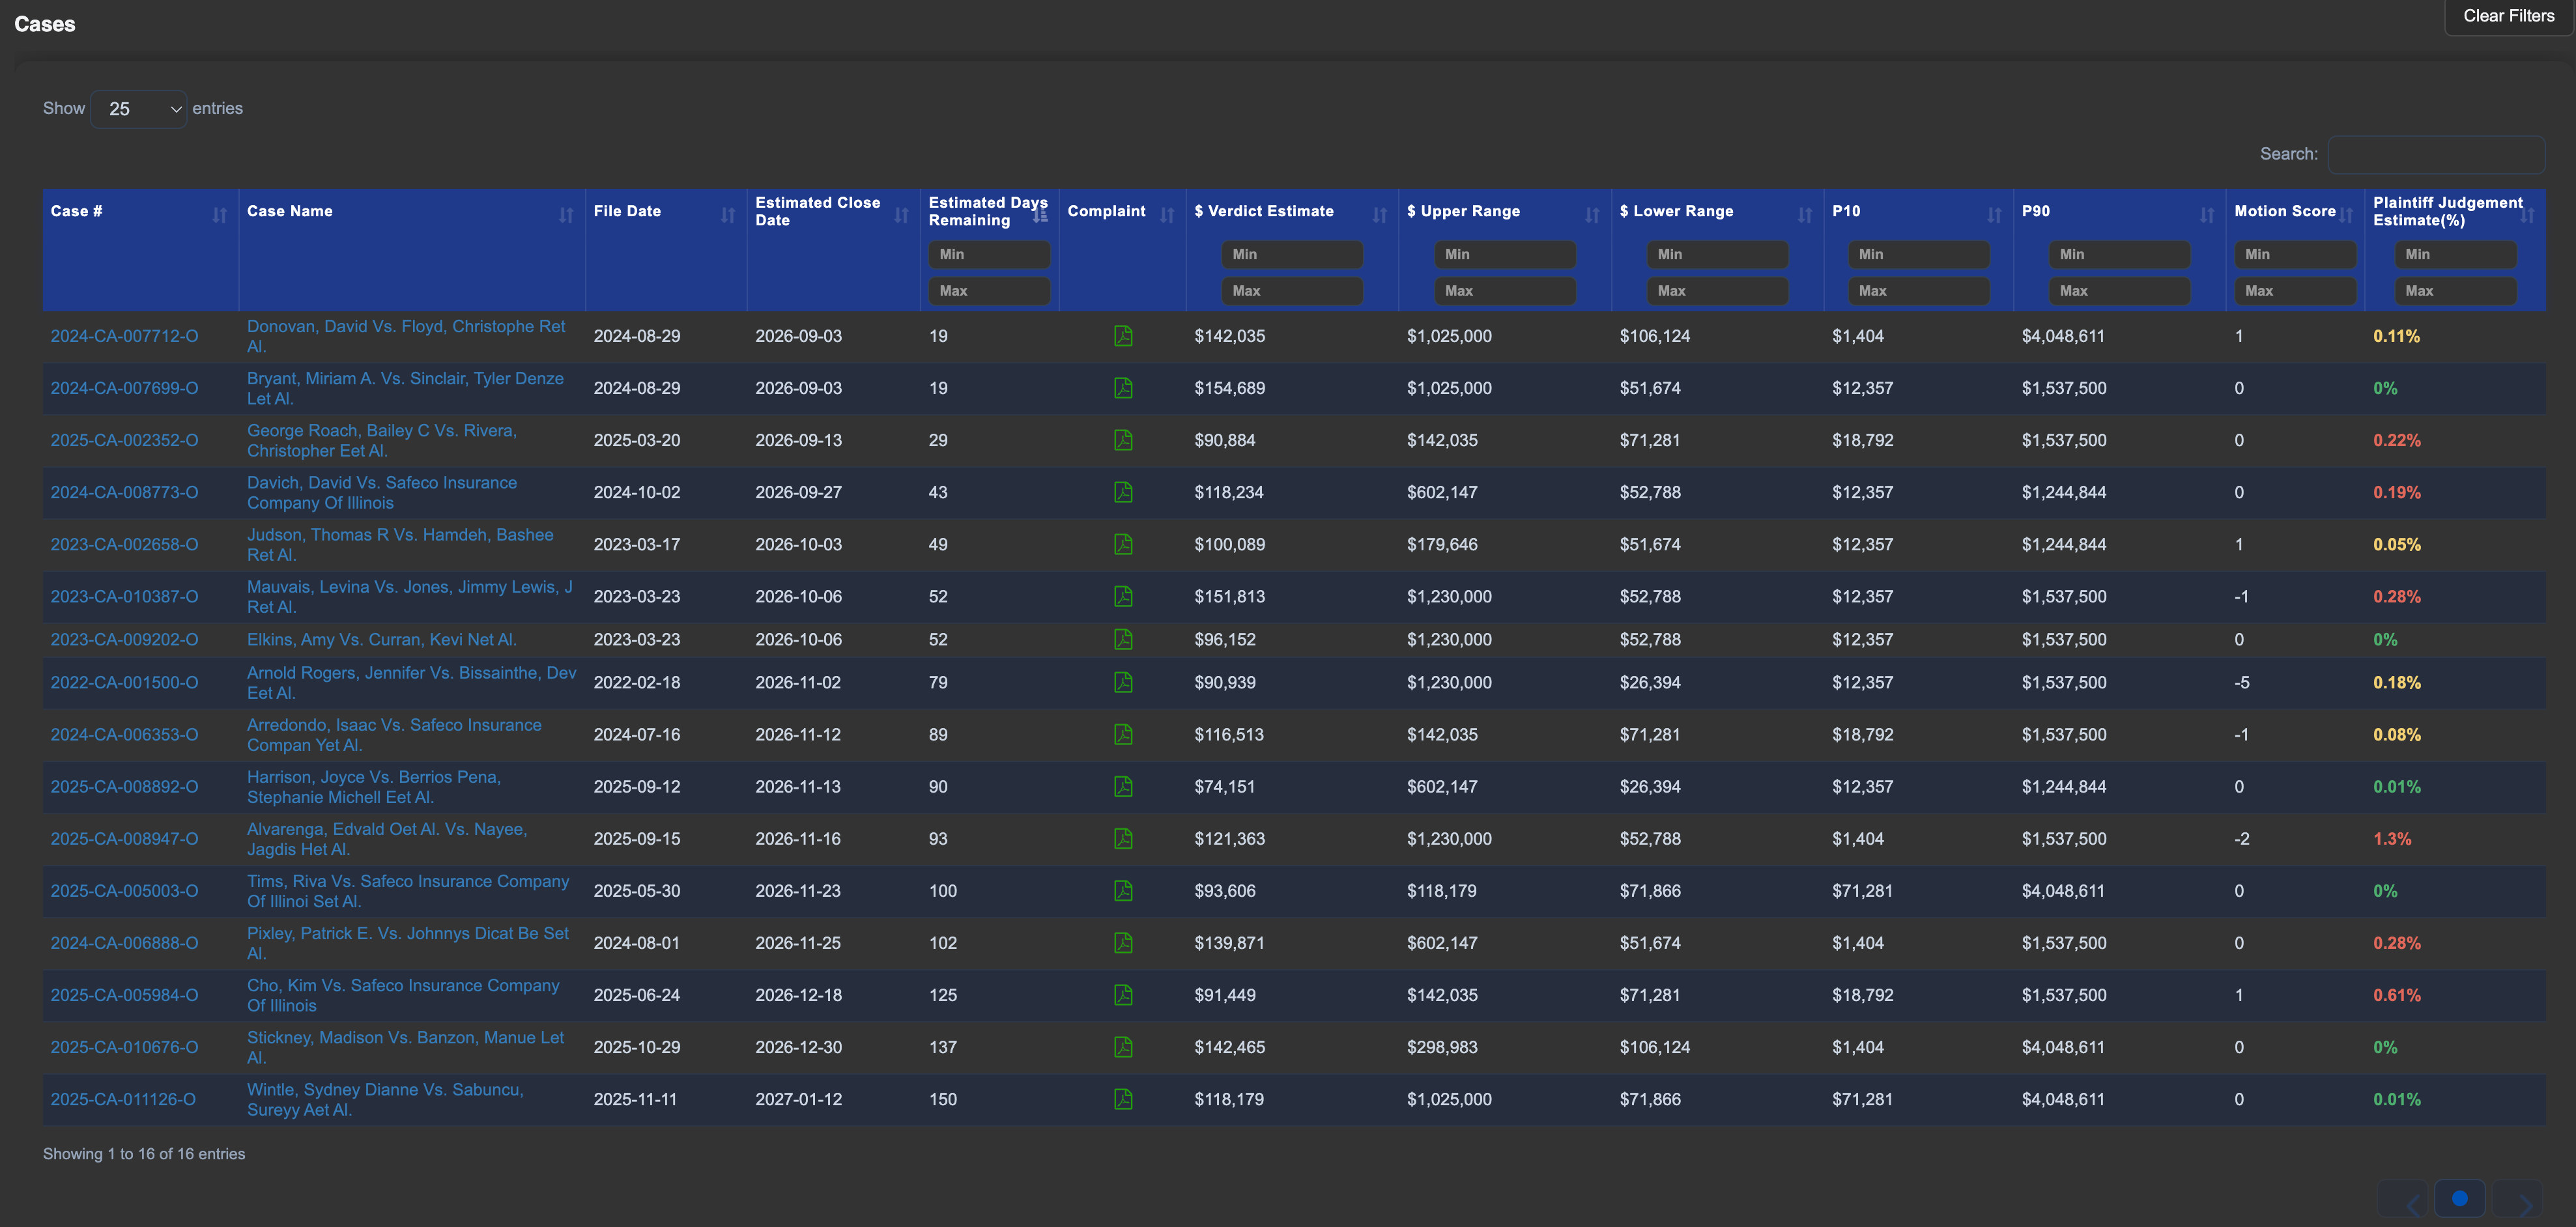
Open cases can be analyzed in a single table to combine with existing actuarial models. More accurate reserving benefits all parties. Since it is a major cost for insurers, being in close control is important.
Candlestick View
A Candlestick View shows a Guitar Hero™ type analysis:
- What is coming?
- When?
- How bad could it be?
It’s a clear vision into your litigation future, with the ability to drill down into individual cases to see the exact factors driving outcomes.